A Correction
[November 20, 2022, by Mary Olson]
I have an error I must own. My mistake does not invalidate any of the data presented on the disproportionate impact of ionizing radiation to girls and women. My mistake is in data communication and visualization: I combined two things that do not belong together, resulting in an error. I must both disclose and sincerely apologize. I will do my best to make corrections and repairs.
Thank you to Dr Alfred Korblein for reaching out to me about this matter. Dr Korblein concurs that the graph below [Figure 1] is mathematically correct. It shows a disproportionate harm from radiation exposure to young girls, compared to exposure to young adult males. The cancer outcomes for the young females are seven (7) times higher than for the adult males.

[Figure 1 – 2012, correct comparisons]
The data used to construct the graph is from the 2006 National Academy of Science report, “The Biological Effects of Ionizing Radiation VII, Phase 2” (BEIR VII). The NAS presents a table in which a data-set, based on the Lifespan Study of A-bomb Survivors, is normalized to a single hypothetical radiation exposure level (1 Gy), in order to more clearly see both age of exposure and biological sex as factors in radiation harm. The overall increase in cancers is in comparison to a control population.
In 2012 I created a different ‘hypothetical’ exposure of 20 mSv, which corresponded to a part of the US atomic worker dose limits, and also to the level discussed, at that time, as “allowable” for school children in Fukushima Prefecture after the nuclear meltdowns at the Tepco Daiichi reactors. Finally, 20 mSv is in range of some CT scans used for medical imaging.
The image in Figure 1, created in 2014 as part of an “info graphic,” does not contain the error I am here to report. If I had continued to use Figure 1, there would be no problem.
This later image (circa 2017) is where the problem lies:

[Figure 2--circa 2017 with mistake in comparison values] This one is wrong, and the red “x” has been added to convey this.
The graphing of the BEIR VII data is a mathematical statement that Figure 1 (and Figure 3, below) describe correctly. In Figure 2, the interpretive line, labeled as 10x difference between cancer outcomes from the exposure of young girls v the exposure of adult males is the mistake.
This image resulted from combining a statement (10 times) that in a different context is a discussion point, with the original graph. I should have spotted the error immediately—but, sadly, I did not.
I have many times presented the difference in cancer rates from exposure of girls versus exposure of men as up to a factor of ten. In a different context, I will continue to say this. Why?
I had the great honor to be mentored by Dr Rosalie Bertell, in the last years of her life. It was she who pointed me to the data in BEIR VII when I was seeking an answer about biological sex as a factor in radiation harm in 2011. Rosalie, a noted mathematician, opined that the uncertainty associated with the initial information about the birth to five-year-old age cohort of A-bomb survivors was likely to be much greater than the information gathered about those who were young adults when the US used the first nuclear weapons on Hiroshima and Nagasaki in 1945.
Rosalie and I acknowledged that uncertainty could throw the numbers either way (higher or lower). As we explored factors that could contribute to this greater uncertainty about the youngest members of the Lifespan dataset, our shared commitment to the wellbeing of future generations inspired us to round up. We wanted to spur more science research by others in a number of fields to begin to fathom why biological sex might be a factor in radiation harm. Here is a summary of the basis for a larger relative uncertainty for the young children:
The biggest uncertainty is the combination of the age of the youngest survivors and the 5 years which elapsed between the atomic destruction of Hiroshima and Nagasaki in 1945 and the beginning of data collection by the US researchers in 1950. These 5 years cast greater doubt about where the young children were during a catastrophic disruption of their community, how well they were shielded, and so what level of radiation exposure they suffered.
Second is a possible research bias—as the Cold War was heating up in 1950, there was a tremendous focus on learning about the impact of radiation exposure on the hundreds of thousands of military and para-military males at work in bomb factories of the Cold War.
Third, there have been additional studies of atomic workers who were primarily young adult males. These studies corroborate the findings about radiation and young adult male A-bomb survivors. This work, with a narrow focus on only one part of the impacted community, was often led by US researchers and contributed to the underpinning of the “Standard” (and later the “Reference”) Man.
Reference Man, to this day, is the only person considered in the radiation safety standards for the general public by the US Nuclear Regulatory Commission.
These factors combined to convince us to round up. There is nothing wrong with this, however it must be owned as such. The resulting comparison never belonged on the “Pink and Blue Graph.”
Figure 3 is the data from BEIR VII without the interpretative lines, showing, unequivocally that biological sex, combined with age, are potent factors in the outcome of exposure to ionizing radiation. This disproportionate harm is of enormous concern—worthy of more research by institutions of excellence.
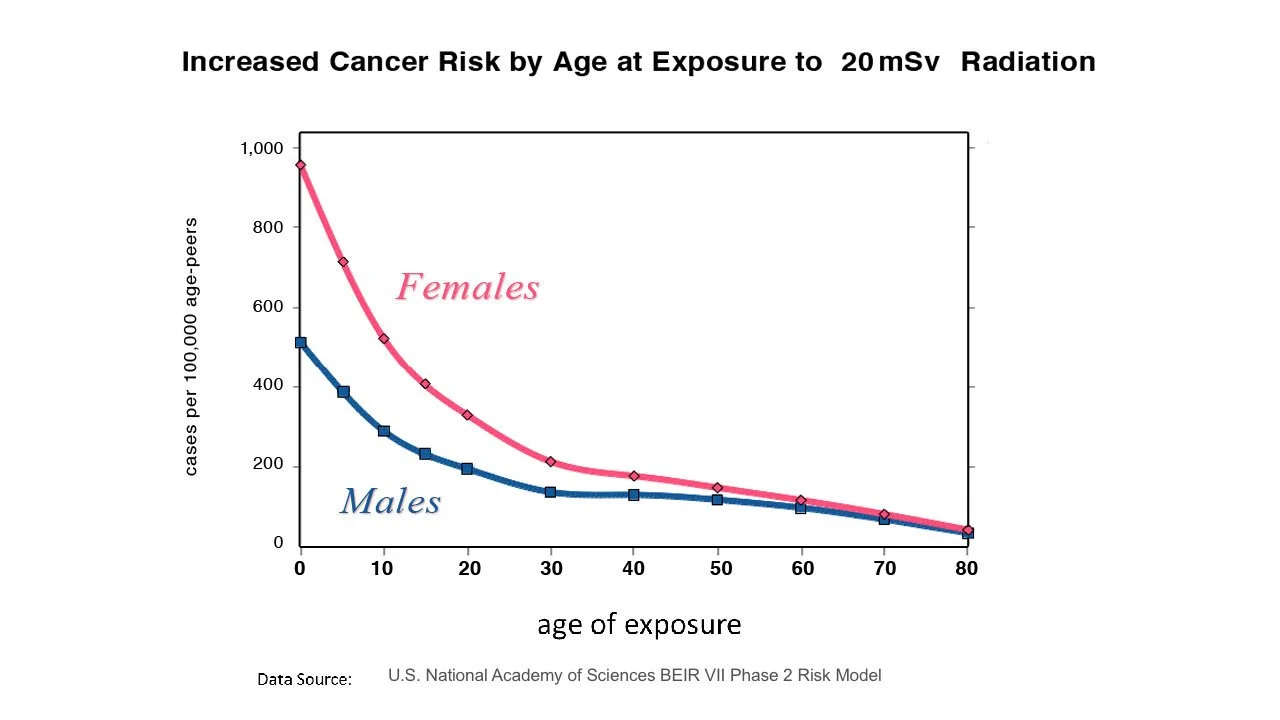
[Figure 3 – original graph, 2012. No problem.]
If you have any questions, I will be happy to engage – contact me – gender.radiation@gmail.com